Uncommon Ground

Biology

A crack in creation

In August, 2012 a paper entitled “A Programmable Dual-RNA–Guided DNA Endonuclease in Adaptive Bacterial Immunity” appeared in Science (doi: 10.1126/science.1225829). I probably saw the title in the table of contents of the August 17th issue and skipped right by. Bacterial immunity isn’t a topic a pay a lot of attention to. OK. Let’s be honest. I don’t pay any attention to bacterial immunity.

Not too long after that paper appeared, I started hearing about something called CRISPR-Cas9. I didn’t know what it was or what it might be useful for, only that a lot of people who were interested in molecular genetics were paying attention to it, especially those who were interested in using molecular tools to edit genomes of complex, multicellular organisms. I started to see newspaper and magazine articles talking about how this new technology would revolutionize biology and medicine in the same way that the discovery and use of restriction endonucleases had revolutionized them in the mid-1970s.

Some of the most ambitious projections suggested that we could be entering an era of designer genes in which gene therapy might be used not only to modify or replace genes that lead to diseases like sickle cell anemia, but in which it might be used to enhance “normal” functions. Not too long after that I started hearing about biologists who realized that CRISPR-Cas9 could be used to build gene drives that might be used to control pest populations. A lot of people began worrying about the ethical issues associated with use of CRISPR-Cas9 (e.g., doi: 10.1093/bmb/ldx002).

In June, two pioneers in the work leading to development of CRISPR-Cas9 published a book outlining the history of the work and exploring some of the ethical implications. I am a little less than halfway through A crack in creation, but so far I have found it very readable and informative. Reading this book is the only reason I know about the Science paper from 2012. Only now, 5 years later, am I taking the time to learn about this new technology. I had an inkling of its power and utility before I started reading, and I was (am still am) uneasy about some potential applications. Since so much of the basic science is very distant from my expertise and experience, I can’t judge the historical accuracy of the story Douda and Sternberg tell, but they seem generous in giving credit to other scientists who made contributions and very aware that their creative insights depended on previous work by many other people. That makes me think that if there are inaccuracies in the story, they are inadvertant and unintentional.

If you’ve been waiting for a good time to learn more about CRISPR-Cas9, your wait is over. Click on the image above, go to Amazon, and buy yourself a copy of A crack in creation or check it out from your library. You won’t be disappointed.

(In case you’re wondering, I don’t know either of the authors, and I won’t get any Amazon affilliate credits if you buy the book from Amazon. I’m endorsing the book only because I’ve found it very informative. It’s also written very clearly, clearly enough that I think your non-biologist friends and relatives would find it interesting and informative, too.)

Using weather to predict growth of forest trees

Last January I mentioned that I co-authored a paper that appeared on bioRxiv in which we combined tree ring and growth increment data to predict growth from weather and biophysical data. The paper has now appeared in Ecosphere, an open acces journal from the Ecological Society of America. Here’s the abstract. You’ll find the full citation below.

Fusing tree-ring and forest inventory data to infer influences on tree growth

Better understanding and prediction of tree growth is important because of the many ecosystem services provided by forests and the uncertainty surrounding how forests will respond to anthropogenic climate change. With the ultimate goal of improving models of forest dynamics, here we construct a statistical model that combines complementary data sources, tree-ring and forest inventory data. A Bayesian hierarchical model was used to gain inference on the effects of many factors on tree growth—individual tree size, climate, biophysical conditions, stand-level competitive environment, tree-level canopy status, and forest management treatments—using both diameter at breast height (dbh) and tree-ring data. The model consists of two multiple regression models, one each for the two data sources, linked via a constant of proportionality between coefficients that are found in parallel in the two regressions. This model was applied to a data set of ~130 increment cores and ~500 repeat measurements of dbh at a single site in the Jemez Mountains of north-central New Mexico, USA. The tree-ring data serve as the only source of information on how annual growth responds to climate variation, whereas both data types inform non-climatic effects on growth. Inferences from the model included positive effects on growth of seasonal precipitation, wetness index, and height ratio, and negative effects of dbh, seasonal temperature, southerly aspect and radiation, and plot basal area. Climatic effects inferred by the model were confirmed by a dendroclimatic analysis. Combining the two data sources substantially reduced uncertainty about non-climate fixed effects on radial increments. This demonstrates that forest inventory data measured on many trees, combined with tree-ring data developed for a small number of trees, can be used to quantify and parse multiple influences on absolute tree growth. We highlight the kinds of research questions that can be addressed by combining the high-resolution information on climate effects contained in tree rings with the rich tree- and stand-level information found in forest inventories, including projection of tree growth under future climate scenarios, carbon accounting, and investigation of management actions aimed at increasing forest resilience.

Evans, M. E. K., D. A. Falk, A. Arizpe, T. L. Swetnam, F. Babst, and K. E. Holsinger. 2017. Fusing tree-ring and forest inventory data to infer influences on tree growth. Ecosphere 8(7):e01889. doi: 10.1002/ecs2.1889

Lecture notes in population genetics – final version from Spring 2017

I’ve finally had time to clean and post the final version of lecture notes from my graduate course in population genetics last spring. The individual lectures have been since I revised them for class, meaning that the last set of them was available in late April. You will find links to the individual lecture notes at http://darwin.eeb.uconn.edu/uncommon-ground/eeb348/notes/. If you’re interested in a particular topic in population genetics and I have a lecture that covers the topic, that’s probably where you’ll want to go.

If you want a single-volume reference to population genetics (including some old notes that I no longer maintain), you’ll find a PDF (5.89MB, 322 pages) at Figshare (doi: 10.6084/m9.figshare.100687.v2). If you want to print the PDF, I recommend that you print it on a double-sided printer. You can then put the pages in a binder and flip through them as if it were a bound book.

If you use LaTeX (and you’re a glutton for punishment), the LaTeX source and EPS files (for figures) is available in a Github repository (https://kholsinger.github.io/Lecture-Notes-in-Population-Genetics/).

These notes are released under a Creative Commons Attribution-ShareAlike license (http://creativecommons.org/licenses/by-sa/4.0/). I hope you find them useful. If you find errors in them, please let me know.

Causes of genetic differentiation in Protea repens

American Journal of Botany Volume 104, Number 5. May 2017.

Protea repens is the most widespread member of the genus. It was one of the focal species in our recently completed Dimensions of Biodiversity project. Part of the project involved genotyping-by-sequencing analyses of 663 individuals from 19 populations spanning most of the geographical range of the species. We summarize results of those analyses in a paper that just appeared in advance of the May issue (cover photo featured above) of the American Journal of Botany. Here’s the abstract. You’ll find the citation and a link at the bottom.

PREMISE OF THE STUDY: The Cape Floristic Region (CFR) of South Africa is renowned for its botanical diversity, but the evolutionary origins of this diversity remain controversial. Both neutral and adaptive processes have been implicated in driving diversification, but population-level studies of plants in the CFR are rare. Here, we investigate the limits to gene flow and potential environmental drivers of selection in Protea repens L. (Proteaceae L.), a widespread CFR species.
METHODS: We sampled 19 populations across the range of P. repens and used genotyping by sequencing to identify 2066 polymorphic loci in 663 individuals. We used a Bayesian FST outlier analysis to identify single-nucleotide polymorphisms (SNPs) marking genomic regions that may be under selection; we used those SNPs to identify potential drivers of selection and excluded them from analyses of gene flow and genetic structure.
RESULTS: A pattern of isolation by distance suggested limited gene flow between nearby populations. The populations of P. repens fell naturally into two or three groupings, which corresponded to an east-west split. Differences in rainfall seasonality contributed to diversification in highly divergent loci, as do barriers to gene flow that have been identified in other species.
CONCLUSIONS: The strong pattern of isolation by distance is in contrast to the findings in the only other widespread species in the CFR that has been similarly studied, while the effects of rainfall seasonality are consistent with well-known patterns. Assessing the generality of these results will require investigations of other CFR species.

Prunier, R., M. Akman, C.T. Kremer, N. Aitken, A. Chuah, J. Borevitz, and K. E. Holsinger. Isolation by distance and isolation by environment contribute to population differentiation in Protea repens (Proteaceae L.), a widespread South African species. American Journal of Botany doi: 10.3732/ajb.1600232 

Happy Birthday Sir David Attenborough

Wildscreen’s photograph of David Attenborough at ARKive’s launch in Bristol, England © May 2003 You are free: to share – to copy, distribute and transmit the work to remix – to adapt the work

Today is Sir David Attenborough’s 91st birthday. If you follow me on Twitter or read this blog, you don’t need me to tell you who he is, but just as a reminder, here is some of his biography from IMDb:

Born 8 May 1926, the younger brother of actor Lord Richard Attenborough. He never expressed a wish to act and, instead, studied Natural Sciences at Cambridge University, graduating in 1947, the year he began his two years National Service in the Royal Navy. In 1952, he joined BBC Television at Alexandra Palace and, in 1954, began his famous “Zoo Quest” series. When not “Zoo Questing”, he presented political broadcasts, archaeological quizzes, short stories, gardening and religious programmes. 1964 saw the start of BBC2, Britain’s third TV channel, with Michael Peacock as its Controller. A year later, Peacock was promoted to BBC1 and Attenborough became Controller of BBC2. As such, he was responsible for the introduction of colour television into Britain, and also for bringing Monty Python’s Flying Circus (1969) to the world. In 1969, he was appointed Director of Programmes with editorial responsibility for both the BBC’s television networks. Eight years behind a desk was too much for him, and he resigned in 1973 to return to programme making. First came “Eastwards with Attenborough”, a natural history series set in South East Asia, then “The Tribal Eye”, examining tribal art. In 1979, he wrote and presented all 13 parts of Life on Earth (1979) (then the most ambitious series ever produced by the BBC Natural History Unit). This became a trilogy, with The Living Planet (1984) and The Trials of Life (1990).

I knew about Life on Earth, The Living Planet, and The Trials of Life (obviously). I didn’t know that he’d introduced color TV to Britain and that he was responsible for “brining Monty Python’s Flying Circus to the world. What an amazing set of accomplishments. His contributions are simply astounding.

More at Wikipedia and Biography

The beauty of fynbos

The beauty of our fynbos from CapeNature on Vimeo.

In case you’ve ever wondered why I have spent so much time working in, thinking about, and writing about Protea this video from CapeNature will give you a bit of a clue. The fynbos is a very interesting place. It has an enormous diversity of plants, many of which are found nowhere else in the world, and much of that diversity is concentrated in a relatively small number of big evolutionary radiations, one of which is Protea.1 One of my students,

Kristen Nolting (@KristenNolting on Twitter) pointed me to this video. Thanks, Kristen.

(more…)

A new phylogeny for Protea

Protea compacta

Protea compacta near Kleinmond, Western Cape, South Africa

The genus Protea is one of the iconic evolutionary radiations in the Greater Cape Floristic Region of southwestern South Africa. Its range extends north through Mozambique into parts of central Africa, but the vast majority of species are found in South Africa. From 2011-2014 we collected samples from most of the South African species (59 in total), and for most of the species we collected samples from several individuals from different populations. Over the last couple of years, we extracted DNA, built libraries for next generation sequencing using targeted phylogenomics, and constructed a highly-resolved estimate of phylogenetic relationships in the genus. The paper describing our results is now out in “early view” in American Journal of Botany. Most species from which we have multiple samples are supported as monophyletic units, and most relationships we identify are strongly supported (> 90% support in ASTRAL-II and SVDquartets analyses). We use the species tree from our data as a backbone to provide reliable estimates of relationship for additional species included in a paper by Schnitzler and colleagues for which we did not have samples.

Mitchell, N., P.O. Lewis, E.M. Lemmon, A.R. Lemmon, and K.E. Holsinger.  2017.  Anchored phylogenomics improves the resolution of evolutionary relationships in the rapid radiation of Protea L. American Journal of Botany doi: 10.3732/ajb.1600227

The influence of climate on tree growth

Northern Hemisphere temperature changes estimated from various proxy records shown in blue (Mann et al. 1999). Instrumental data shown in red. Note the large uncertainty (grey area) as you go further back in time.

Ecologists and paleoecologists have used the width of tree rings for years as a way of inferring past climates. In fact, tree ring data were an important component of the proxy data Mann et al. (1998) used when they constructed their famous1 hockey stick representing global surface temperatures over the last millennium. I don’t have anything as earth shattering as a hockey stick to share with you, but I am pleased to report that a paper on which I am a co-author demonstrates how to combine tree ring and growth increment data (with other data) to predict growth of forest trees. Here’s tha abstract and a link to the paper on bioRxiv.

https://doi.org/10.1101/097535

Fusing tree-ring and forest inventory data to infer influences on tree growth

Better understanding and prediction of tree growth is important because of the many ecosystem services provided by forests and the uncertainty surrounding how forests will respond to anthropogenic climate change. With the ultimate goal of improving models of forest dynamics, here we construct a statistical model that combines complementary data sources: tree-ring and forest inventory data. A Bayesian hierarchical model is used to gain inference on the effects of many factors on tree growth (individual tree size, climate, biophysical conditions, stand-level competitive environment, tree-level canopy status, and forest management treatments) using both diameter at breast height (DBH) and tree-ring data. The model consists of two multiple regression models, one each for the two data sources, linked via a constant of proportionality between coefficients that are found in parallel in the two regressions. The model was applied to a dataset developed at a single, well-studied site in the Jemez Mountains of north-central New Mexico, U. S. A. Inferences from the model included positive effects of seasonal precipitation, wetness index, and height ratio, and negative effects of seasonal temperature, southerly aspect and radiation, and plot basal area. Climatic effects inferred by the model compared well to results from a dendroclimatic analysis. Combining the two data sources did not lead to higher predictive accuracy (using the leave-one-out information criterion, LOOIC), either when there was a large number of increment cores (129) or under a reduced data scenario of 15 increment cores. However, there was a clear advantage, in terms of parameter estimates, to the use of both data sources under the reduced data scenario: DBH remeasurement data for ~500 trees substantially reduced uncertainty about non-climate fixed effects on radial increments. We discuss the kinds of research questions that might be addressed when the high-resolution information on climate effects contained in tree rings are combined with the rich metadata on tree- and stand-level conditions found in forest inventories, including carbon accounting and projection of tree growth and forest dynamics under future climate scenarios.
(more…)

Don’t overinterpret STRUCTURE plots

Screen Shot 2016-08-21 at 4.11.10 PM
Several weeks ago1 Daniel Falush (@DanielFalush) posted a preprint on bioRxiv, “A tutorial on how (not) to over-interpret STRUCTURE/ADMIXTURE bar plots”. I finally had a chance to read it this weekend. Here’s the abstract:

Genetic clustering algorithms, implemented in popular programs such as STRUCTURE and ADMIXTURE, have been used extensively in the characterisation of individuals and populations based on genetic data. A successful example is reconstruction of the genetic history of African Americans who are a product of recent admixture between highly differentiated populations. Histories can also be reconstructed using the same procedure for groups which do not have admixture in their recent history, where recent genetic drift is strong or that deviate in other ways from the underlying inference model. Unfortunately, such histories can be misleading. We have implemented an approach (available at www.paintmychromsomes.com) to assessing the goodness of fit of the model using the ancestry ‘palettes’ estimated by CHROMOPAINTER and apply it to both simulated and real examples. Combining these complementary analyses with additional methods that are designed to test specific hypothesis allows a richer and more robust analysis of recent demographic history based on genetic data.

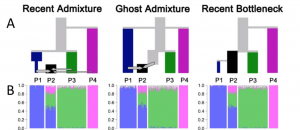
A key observation Falush and his co-authors make is that different demographic scenarios can lead to the same STRUCTURE diagram. They illustrate three different scenarios. In all of them, they simulate data from 12 populations but sample from only four of them. In all of the scenarios, population P4 has been isolated from the other three populations in the sample for a long time. It’s the relationship between P1, P2, and P3 that differs among the scenarios.

  • Recent admixture: P1 and P3 have also been distinct for some time, and P2 is a recent admixture of P1, P3, and P4.
  • Ghost admixture: P1 and P3 diverged some time ago, and P2 is a recent admixture of P1 and a “ghost” population more closely related to P3 than to P1.
  • Recent bottleneck: P1 is sister to P2 but underwent a strong recent bottleneck.

Screen Shot 2016-08-21 at 4.19.59 PM

As you can see, the STRUCTURE diagrams estimated from data simulated in each scenario are indistinguishable. They also show that if you have additional data available, specifically if you are lucky enough to be working in an organism with a lot of SNPs that are mapped, then you can combine estimates from CHROMOPAINTER with those from STRUCTURE to distinguish the recent admixture scenario from the other two – assuming that you’ve picked a reasonable number for K, the number of subpopulations.2

The authors also refer to Puechmaille’s recent work demonstrating that estimates of genetic structure are greatly affected by sample size. Bottom line: Read both this paper and Puechmaille’s if you use STRUCTURE, tread cautiously when interpreting results, and don’t expend too much effort trying to estimate the “right” K.


1OK, as you can see from the tweet, it was almost a month ago.

2The paper contains a brief remark about how hard it is to estimate K: “Unless the demographic history of the sample is particularly simple, the value of K inferred according to any statistically sensible criterion is likely to be smaller than the number of distinct drift events that have significantly impacted the sample. What the algorithm often does is in practice use variation in admixture proportions between individuals to approximately mimic the effect of more than K distinct drift events without estimating ancestral populations corresponding to each one.”

Falush, D., L. van Dorp, D. Lawson. 2016. A tutorial on how (not) to over-interpret STRUCTURE/ADMIXTURE bar plots. bioRxiv doi: 10.1101/066431
Lawson, D.J., G. Hellenthal, S. Myers, and D. Falush. 2012. Inference of population structure using dense haplotype data. PLoS Genetics 8:e1002453. doi: 10.1371/journal.pgen.1002453
Puechmaille, S.J. 2016. The program structure does not reliably recover the correct population structure when sampling is uneven: subsampling and new estimators alleviate the problem. Molecular Ecology Resources 16:608-627. doi: 10.1111/1755-0998.12512