
In Thursday’s lecture there was a very good question about the posterior distribution of allele frequencies in the ABO blood group system. I promised to produce a histogram illustrating the posterior distribution. It took a bit longer than I had hoped, but I have results to share.
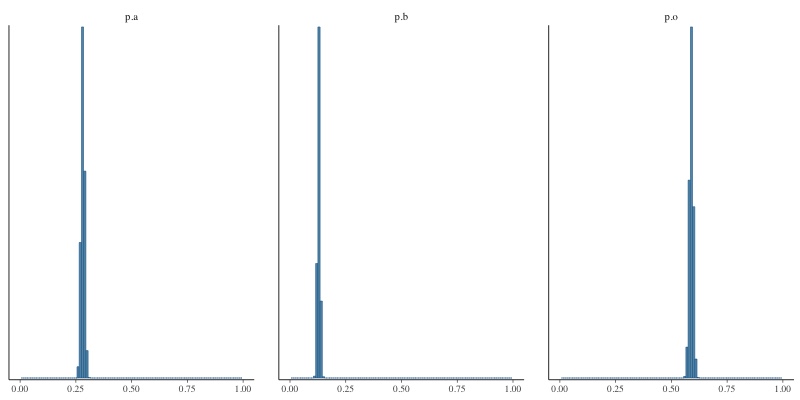
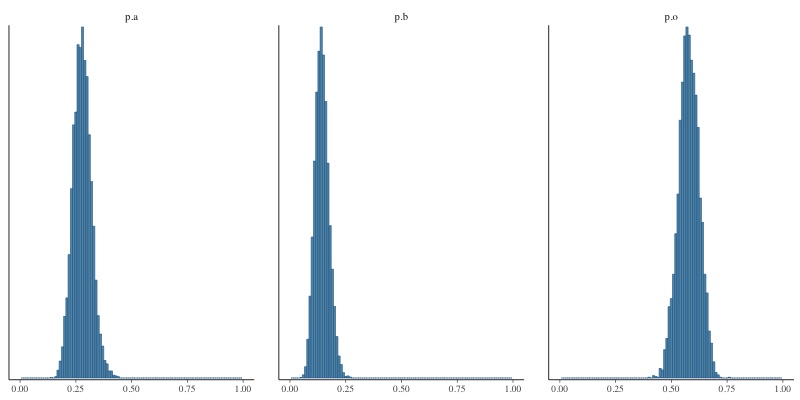
What you see above are histograms showing how often each of the three allele frequencies took on a particular value in one run of the MCMC sampler in JAGS. The sample size is quite large (862 A, 131 AB, 365 B, and 702 O), so the distributions are very narrow, meaning that we have a high degree of confidence in our estimates: 0.281 a, 0.129, b, 0.589 o. If we reduce the sample size to 29 A, 4 AB, 14 B and 23 O, you’d expect the posterior distributions to be broader and you’d be right. Here’s the result:
I’ve updated multinomial.R to produce the histograms you see here after you run the code. You’ll need to install ggplot2 and bayesplot in order to produce the histograms. If you have trouble with that, Kristen can help you on Tuesday.
I encourage you to fiddle with sample sizes that are specified in the code and see how the posterior distributions change. Also compare the posterior distributions to the 95% credible intervals reported in the printout.